Explore satellite images and extract analysis using Landviewer
When it comes to looking for specific data (AOI - Area of interest) for information from remote sensors, EOS - Earth Observing System is one of the most used web platforms; both for search, selection and downloading of images from satellite platforms. This platform has recently integrated some spatial data extraction tools, which are worth talking about.
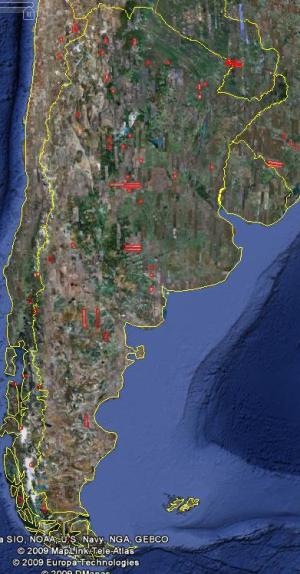
The main interface of the Landviewer is composed of a left side panel, where all the products of each of the spatial sensors are shown, which are related to the AOI, a toolbar in the left margin, which contains functions such as: draw AOI (rectangular, polygonal, or circular), measure, identify installation, list of layers, share, time series analysis and 3D views. In the lower area is the scale, the location coordinates of the area.

Previously, in the location box, the area of interest was placed and all the images related to that point were shown. Now, when searching for the necessary location, an AOI is automatically constructed that later allows access to the product library. In addition to this, it must be taken into account that before you can see, search, select and download any scene, you must register on the page before carrying out any process, since when registering you enter a trial period of 15 days with those who obtain these benefits:
Flexible search, wide selection of low, medium and high resolution images, unlimited use of combinations and indexes, creation of custom indexes, access to historical data, multiple areas of interest, and WMS to import data into any GIS.

 The platform -that was previously free- It has extensive and new benefits. Before you could download at least 10 satellite products from this page, without any restrictions; now, with the new updates, it's a bit more specialized.
When the construction of the AOI is completed, all the scenes associated with this area are automatically presented. The left panel will show all the platforms that contain data in that location, later it can be filtered, according to the purpose of the study. The satellite platforms from which products can be chosen are: Sentinel-2L1C + 2A, Landsat 8 OLI + TIRS, Landsat 7 ETM +, Landsat 4-5 TM, CBERS-4 MUX, CBERS .4 WFI, CBERS-4 PAN5, CBERS 4 -PAN10 and NAIP.
The advantage of using AOI is that the platform will not show results that do not correspond or that do not cover the target area, all modifications to the page are intended so that the area of interest is completely covered by the satellite product of the selected sensor. This is very important, since in other download platforms such as the USGS, or the Alaska SAR Facility, they allow a point to be located, but they do not guarantee that that point is completely covered by the scene. This helps reduce time spent searching and selecting products, and the analyst can spend more time pre or post-processing.
When working with AOI, you will not be given or displayed any random images that do not match or specifically cover the area that has been selected.
 Other type of filters can be used as the source of the images, that is, if they are passive day-night sensors, low-resolution passive sensors, active sensors, terrain data, EOS file data, and high-resolution images. . One of the most interesting page updates is that they help the researcher to identify which days contain products related to their AOI, previously a start and end date was placed and all the corresponding scenes were displayed.
When you click on the calendar, you can see dates highlighted in blue, that happens when there are scenes available, and you do not have to search for other days, but with the blue marks, you can be sure which days contain scenes.
Since the platform contains optical images and these are more sensitive to atmospheric factors such as cloudiness, there is also a filter that helps discard images that contain a high percentage of cloudiness. In addition, it is possible to subscribe to receive notifications about new scenes related to the AOI, or if some other isolated search was made, the system or remember and send notifications of product availability.
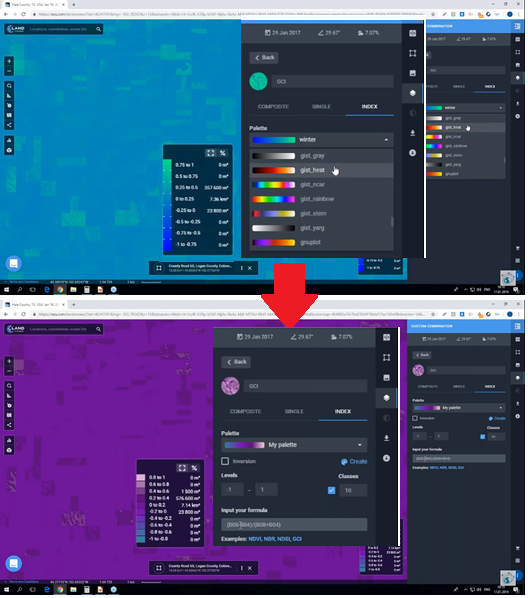
The application saves all the AOIs, which have been created, over time, they can be downloaded, with another of the tools that have been added, extraction of the AOI to shape format or deleted as required. Regarding the use of indexes, before the update, scenes could be viewed, with the most commonly used indexes such as NDVI or NDWI, now they have added many more indexes, such as the SAVI, ARVI, EVI, SIPI or GCI Grassland Clorophile Index.

The user, depending on the purpose of the study, can modify the indices, place the name he or she considers, choose the color palette that is most representative for their study -or create a new-, have achieved many facilities, integrating the user to the processes in a simple way.
 Another interesting tool is the analysis, which allows you to observe the periods where there were previously scenes, and you can see how the previously selected AOI has evolved. You can make visualizations between common scenes, or the indexes that the platform provides. The timeline can go from 1 to 6 months, or from 1 year to 10 years, if a specific period is required, it can also be placed.
In this new stage of the Landviewer, it is possible to visually modify the images, since it is known that by atmospheric or other factors can be very clear or very dark, so the constrast functionality has been added. stretching, to balance the histogram, in those peaks of darkness or high lighting that the scene has.
There are 4 quick options to modify the image:
- Stretching the local histogram,
- stretch histogram complete data set,
- local section of cumulative cut,
- Culinary stretch cut (default).
 Adding the above, you can:
 Add layers to the view through WMS servers, the scenes can be downloaded, with the cut of the AOI, so located with the search box (1) or the complete product, the area measurements are quite simple, you can access the list of layers that were used throughout the process of entering the platform (from the base map, through MDT land, to the last image used).
- They introduce the possibility of sharing the scene in social networks, such as on twitter, LinkedIn, Facebook, or through a link (2). Likewise, if there is any inconvenience in the platform, the support team is contacted in the button housed in the lower left part of the screen (3).
It is important to see how tools like these, help improve and facilitate the processing of data, and the construction of spatial analysis. This technology is based on data in the cloud, you can save in the EOS cloud a large number of products and access them from any computer, the only thing that must be taken into account is that it is no longer a free platform, it is worth worth paying for the services offered. We will see in the near future if this type of tools, will partially or completely replace the GIS and PDI applications (Digital Image Processing), which have been used in recent times such as ERDAS Imagine or ENVI.

To enter, register and get the 15 test days, go to the following link: Landviewer-EOS.