
Draw points, lines and texts of a polygonal from Excel to AutoCAD
I have this list of coordinates in Excel.
| No. | X | Y |
|---|---|---|
| 1 | 374,037.80 | 1,580,682.41 |
| 2 | 374,032.23 | 1,580,716.26 |
| 3 | 374,037.74 | 1,580,735.15 |
| 3A | 374,044.99 | 1,580,772.50 |
| 4 | 374,097.78 | 1,580,771.83 |

In these there is an X coordinate, a Y coordinate, and also a name for the vertex. What I want is to draw it in AutoCAD. In this case we will use the execution of scripts from concatenated text in Excel.
Concatenate a command for the insertion of points in AutoCAD
The table shown in the graph, as you can see, includes a column with the name of vertex, then UTM coordinates for columns X, Y.
The first thing we must do is concatenate the coordinates as the AutoCAD command expects them. For example, to draw a point we will occupy: POINT coordinateX, coordinateY.
So, what we will do is insert a new column with this concatenated data, in the form:
POINT 374037.8,1580682.4
POINT 374032.23,1580716.25
POINT 374037.73,1580735.14
POINT 374044.98,1580772.49
POINT 374097.77,1580771.83
POINT 374116.27,1580769.13
To do this concatenation I have done the following:
- I have called the cell D4 with the name POINT,
- I have created with the concatenate function, a string that includes the POINT cell, then I have left a space using " ", then I have concatenated cell B5 with a two-digit rounding, then to draw the comma I have used ",", then I have concatenated cell C5. Then I have copied for the rest of the rows.

Draw the points in Excel
 I have copied the contents of column D to a text file.
To execute it, you type in the command bar SCRIPT, then the Enter key. That brings up the explorer and I look for the file that I have called geofumadas.scr. Once selected, the open button is pressed.
And voila, there we have the vertices drawn.
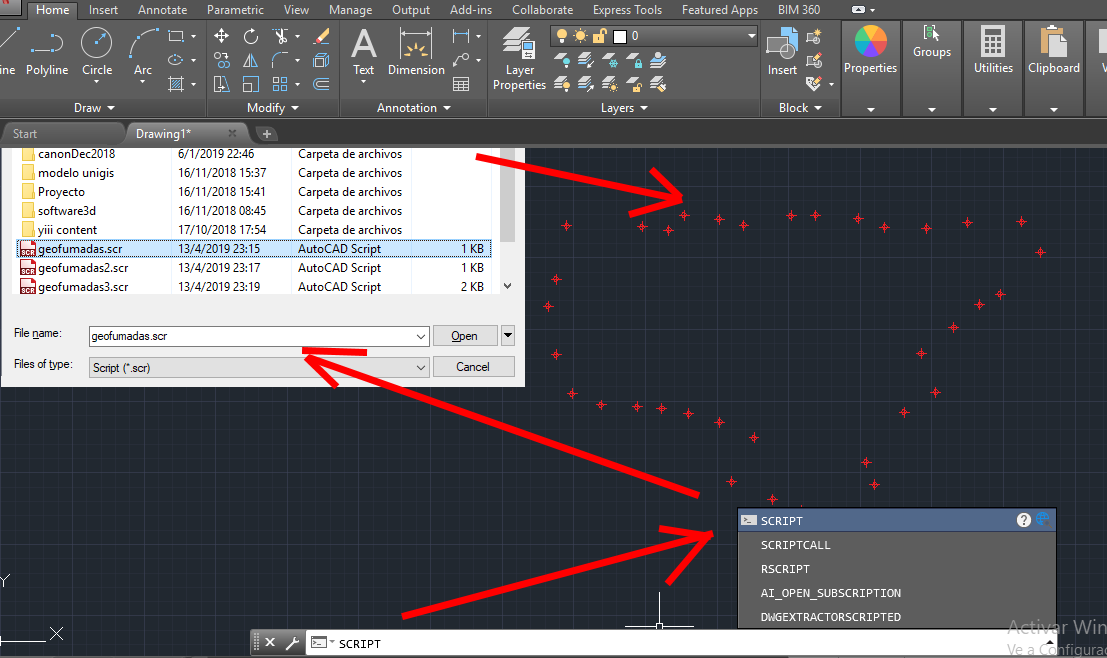
In case the points are not visible, it is necessary to zoom in on the complete set of objects. For this we write the command Zoom, enter, Extent, enter.
In case the points appear not very visible, the PTYPE command is executed, then the one indicated in the image is selected.

Concatenate the command in Excel and draw the polygon in AutoCAD
To draw the polygon it will be the same logic. with the variant that we will occupy the PLINE command, then the concatenated coordinates and finally the CLOSE command.
PLINE
374037.8,1580682.4
374032.23,1580716.25
374037.73,1580735.14
...
374111.31,1580644.84
374094.32,1580645.98
374069.21,1580647.31
374048.83,1580655.01
CLOSE
We will call this script geofumadas2.scr, and when we execute it we will have the trace of the drawing. I selected yellow color to notice the difference with the red vertices.

Concatenate the command in Excel and note the vertices in AutoCAD
Finally, we occupy annotating the texts of the first column as annotations at each vertex. For this, we will chain the command in the following way:
TEXT JC 374037.8,1580682.4 3 0 1
This command represents:
- The TEXT command,
- The condition of the text, in this case justified, that's why the letter J,
- The central point of the text, we chose Center, that's why the letter C
- The concatenated coordinate X, Y,
- Then the size of the text, we have chosen 3,
- The angle of rotation, in this case 0,
- Finally the text that we hope, that in the first row will be the number 1
Already propagated to the other cells, it will be as follows:
TEXT JC 374037.8,1580682.4 3 0 1
TEXT JC 374032.23,1580716.25 3 0 2
TEXT JC 374037.73,1580735.14 3 0 3
TEXT JC 374044.98,1580772.49 3 0 3A
TEXT JC 374097.77,1580771.83 3 0 4
TEXT JC 374116.27,1580769.13 3 0 5
TEXT JC 374127.23,1580779.64 3 0 6
...
I called the geofumadas3.cdr file

I have activated green color, to notice the difference. Once the script is executed, we have the text in the indicated size, right in the center of the coordinate.
Download the AutoCAD file used in this example.
The article shows how the template is built. If you use the template in Excel, already built to only feed data, You can buy it here.


I need help
I must draw hundreds of rectangles that represent mining concessions, they are rectangles with a midpoint and sides x and y, I need help, I have the data in excel