
Philosophizing about AdSense
There is the full post in Los Blogos, a position regarding the possibility of making a monitoring plan for AdSense income by applying a mx + b line graph. I confess that I have put my nose in part of the content.
Here I leave the review ...
1. The base data
blah blah blah based on two years of data ...
2 Projection
After entering the data, you can then calculate the expected value in the linear graph throughout the year, which will behave in the way y = mx + b
m is the slope (derived), in this case we find 4.63, x is equivalent to the number of months starting annually from 1 to 12. M may be higher as well-planned SEO measures are applied, however 4.63 is a reference point in our case.
b is the intersection of the abscissa, it will be equal to the accumulative dragged value, which, as I said before, is 33% on the increase for the year plus a 10% increase that Google gives us for loyalty (or consolation). It is also likely that this is a result of the traffic growing as long as a constant publication is maintained, a well-defined segment and no punishable advertising practices are carried out.
So the graph for the first year that starts from scratch would be
y = 4.52 X + 18.81 (with an annual average of $ 48)
y = 4.73 X + 133.91 (with an annual average of $ 165)
y = 4.63 X + 177.98 (with an annual average of $ 208)
y = 4.63 X + 240.27
![image_thumb [20]](https://www.geofumadas.com/wp-content/uploads/2008/12/image-thumb20.png)
The graph that reflects the different stages as a market plan would:
![]() The red zone: … It is quite adapted to the introduction stage in the life cycle of products.
The red zone: … It is quite adapted to the introduction stage in the life cycle of products.
![]() The yellow zone: ... It adapts to the growth stage.
The yellow zone: ... It adapts to the growth stage.
![]() The orange zone: ... It adapts to the stage of maturity.
The orange zone: ... It adapts to the stage of maturity.
![]() The coffee zone: ... This adapts to the saturation cycle.
The coffee zone: ... This adapts to the saturation cycle.
![]() The green Zone: ... good time to consider a new product curve ... because the declination stage can come if you don't have something thought for later.
The green Zone: ... good time to consider a new product curve ... because the declination stage can come if you don't have something thought for later.
Monitoring
If there is a comparison framework, then there could be a way to apply changes, efforts and preventions to see if they yield better results. How to say, I'm in year 4, what average minimum I can expect, what my likely income would be in May and what is the worst drop I can accept.
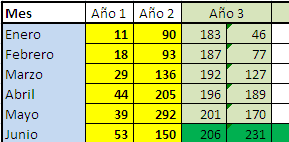
The graph shows several fields that can be used to check if the behavior is below the expected minimum. The yellow spaces can be used based on real data, at least two years, then the columns from year 3 include a minimum expected value and the minimum drops and probable rises.
3. The unforeseen
There are some aspects that are not predictable, among them we can mention:
- A wiggle
- The postmeneo
- Low traffic cycles
- Security Failures
- Other contingencies
blah blah blah ... some of these unforeseen can be prevented, others ... no.
4. CONCLUSIONS
-Although there are those who consider that the initial investment is not necessary or that it is possible to do it yourself, it will depend on this to reach a derivative above 4.5%. Possible investments include non-penalizable advertising by Google, search engine optimization, creative design, branding, among others.
-The study reflects that the average income for the year may be the average income for May and June.
-If having this data, having this average, it can be considered that the total income for the year will be that average multiplied by 12
-From the third year a minimum graphic reprojection can be made, in case of exceeding the 4.5% derivative, an 6.5% could be expected and planned accordingly.
-The results show that the best months are July and August (although they are the result of the previous two months) and that the worst falls are in January and September.
-This suggests that three years is the time that a blog should require to be a differentiated and recognized brand.
Well, go there and tell me.


