Google Analytics, as a desktop application
Google Analytics is a solution that we constantly use who have blogs or pages on the Internet, to know the sources of traffic, words by which visitors arrive, browsing time and in general to see if our site is growing.
I have heard through Punto Geek de Analytics Air; an application developed on the Google Analytics API, requires Adobe Air to run. But, if you already have Google Analytics online, why might someone need it as a desktop application.
1. To not leave a navigation trace on your LAN
This can be a good alternative for those who browse from a business network, because although their browsing will not be anonymous, many hours of browsing in analytics.google will not appear in their network user ... and the weight involved in downloading flash graphics then the desktop application only downloads calls to the database and the charts are executed locally. Which means less bandwidth consumed ... as long as the proxy does not block you ...
2 To get some advantages offered by the desktop application Analytics Air does not have all the features that Google Analytics has, but it has the most important to know statistics of origin traffic, landing pages, countries where visitors come from and more of some improvement in functionality.
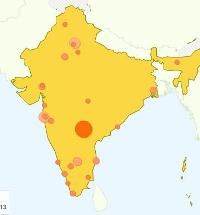
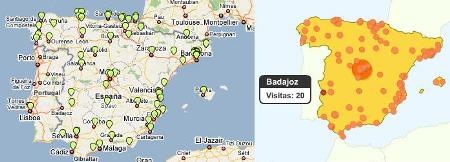
The maps. Eta is one of the improvements, the deployment of maps by location, which is built on the Google Maps API
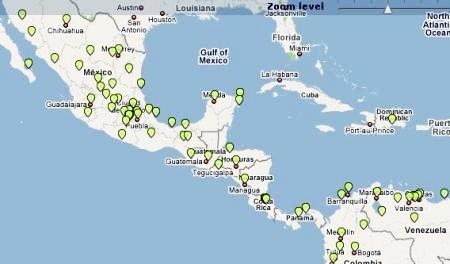
You can see bullets about the cities where visitors come from, which in Analytics can only be seen by selecting the country. This would be the case of Spain, showing both examples with the traffic that Geofumadas has.
Tabs. In the case of Analyticx, only one view can be seen, in the case of Analytics Air, use style tabs Firefox, which are very practical to change from one view to another

Among the things that could be improved are the pie charts that are not yet integrated and the theming of bullets on the map according to ranges. And if you want to earn our admiration, you would do very well to add weekly and monthly statistics graph that we have been missing for days ... ah, and the option to change that annoying blue color in the background.
It is good that they have a tab to add suggestions, so I suppose that they will gradually integrate relevant improvements.