
Create an electoral map with Fusiontables - in 10 minutes
Suppose we want to reflect on a map, the electoral results of the municipalities, so that they can be filtered by political party and shared with the public. While there are more less lay ways to do it, I want to show the example to explain how it can be done with FusionTables by an ordinary user.
What we have:
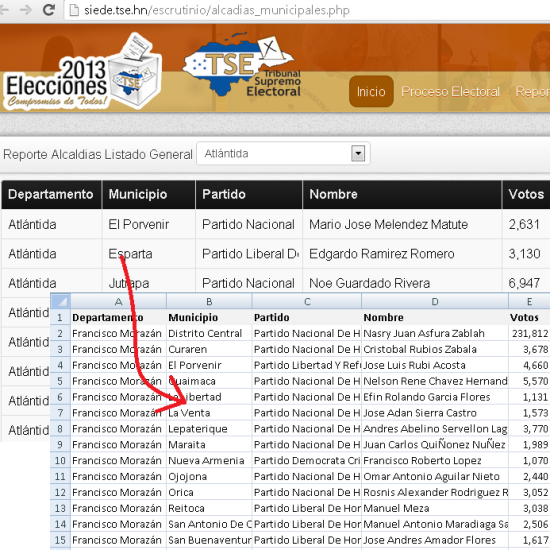
The published result of the Supreme Electoral Tribunal, where you can see the listing by municipality.
http://siede.tse.hn/escrutinio/alcadias_municipales.php
Minute 1. Build the table
This is done by copying and pasting from the table available by the Supreme Electoral Tribunal to Excel. Special copying is used, only text, and since there is no country display, you have to filter for each of the 18 departments. The advantage with Chrome is that the selection is made, even if we change the filter so that we only have to be doing Ctrl + C.
We leave the header only in the first row.
As the table does not have a coordinate, it will be necessary to georeference it using geocode. To do this, we will concatenate the columns so that Google does not get confused when looking for the locations; we require you to search for municipality, department, country.
In column F, we will use the concatenate formula like this: = CONCATENATE (Township column","Department Column",","Country“), we are also concatenating commas between quotes to ensure that the string looks as expected. So the column in row 2 would look like this:
=CONCATENATE(B2,”,”,A2,”,”,”honduras”) and as a result that row would be: Central District, Francisco Morazán, Honduras
We will call the header of this column E “Concatenate”
Minute 5. How to upload it to FusionTables
FusionTables is installed in the Google Chrome browser, and when you call it to create a new sheet from this link, This panel should appear.
You can choose a sheet available in Google Spreadsheets, create a blank or upload the one we have on the computer.

Once selected, select the “Next” button. It will ask us if the name of the columns is in the first row, then we do “Next” and then it will ask us what name we give to the table and some descriptions that can also be edited later.
Minute 7. How to georeference the table
From the File tab, the “Geocode…” option is selected and it asks us which column contains the geocode. We indicate the column that we have defined before.

If we had not created a concatenated column, we could have defined the municipality, but because there are so many names repeated in many countries, we would have gotten scattered points outside of Honduras. Also within the same country there are municipalities with the same name, for example "San Marcos", if we did not concatenate the department we would also have had that difficulty.
There is an option called “ad location hint”, which in this case is not necessary because the entire chain already contains the information up to the country level.
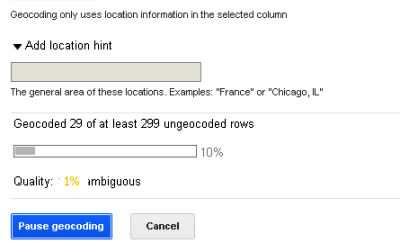
The system begins to locate each location based on the criteria that we have defined. Below, it indicates in orange the percentage of ambiguous data, which generally will happen with locations that Google has not yet identified in its database; in my case of 298, only 6 were ambiguous; usually Google places them in another country because they exist somewhere.
Minute 10, there they have it

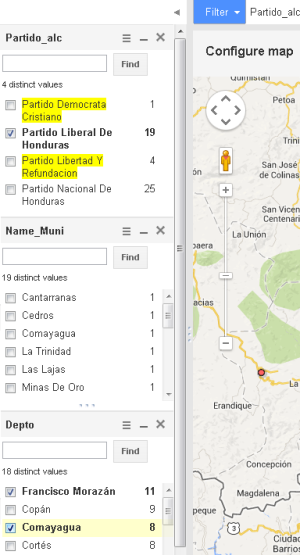
If a point was out of place, it is edited in the “Row” option, by double clicking on the field and in the “edit geocode” link, improving the search and indicating the place that resolves the ambiguity. If it doesn't exist, then you can indicate a nearby location that we see in Google tags.
In the filters option, it is possible to add panels to turn on, off and count by game, by department, by municipality ... etc.
Here you can see the example. It does not have the final data as I did it with information that was still being processed, also fiddling with some tables making a merge with area and municipality code from another table ... but as an example there is the link. I also did not do the internal correction for an elementary error and hoping that the 10 minutes were enough.
Other functionalities:
You can merge tables, edit directly, publish and some other basic things. To do more, there is the API.
Of course, this is done by means of points.
If we wanted to use shapes for the columns you can use the Shapescape service (hopefully it's not down) ... although you want more than 10 minutes.


