
Can you impress with a single map?
Hello my friends, before I go on vacation, time that I do not expect to write much I tell a story a little long but necessary for the geophysatans on the eve of Christmas.
This week I have received some cooperating gentlemen asking me for a map of the area where we currently do the cadastral survey. Knowing that the GIS technician went on vacation I asked them a couple of hours looking to impress them, it would be high not to give them a good result and incidentally write the experience in my last post from home.
So here's the comparison between these four tools that I used to play with the allowance allowed by the map when I left the plotter: AutoCAD, Microstation, ArcView, Manifold and Google Earth. I am aware that for tastes the colors, each one is convinced of the girl with whom he likes to dance in good night:
Although all We would like an application that was so colorful for painted maps, so versatile to interact with other systems and so accurate for vector editing.
I did not want anything astral, alone print a 1 cadastral map: 1,000 of the E0312Y quadrant, in the 16 North zone, with UTM Cylindrical projection and the background Google Earth orthophoto. With the thematized plots by area, transparent to an 50% and the Grid WGS84
Although I have not done it with AutoCAD or Microstation, I took two minutes to analyze what would happen; The initial map was in dxf so no one has the advantage:
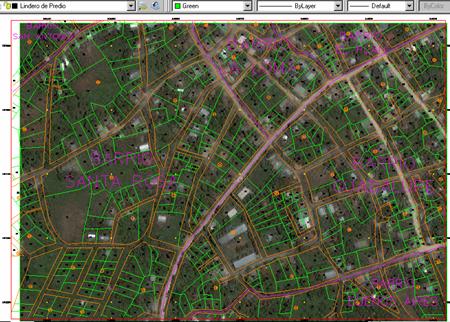
If you did with AutoCAD
: )
- Easy to call the image, Easy to move the place and give it the turn although it can not be exported to another format and from time to time slows the panning.
- Easy vectorial editing, very familiar iconography
- Ingerfase friendly, after seeing so much
🙁
- Complex set up a print pen in a short time, you would have to modify the properties from the side panel instead of using the layers
- Creating the shapes is not so fast although you can add colorful fillings and transparencies ... and fight with the line style (lts)
- What to say about the layout ... it is still tortuous, I would have to configure the line style because it is not dynamic and tear the clothes to find a dynamic graphic scale ... the UTM grid only with Map3D
- It is not possible to interact with Google Earth Without the printsreen And there is no easy way to assign geodetic projection without Map3D.
In conclusion, useful for CAD use, friendly but if it could create an AutoBentley
If I did it with Microstation:

: )
- Easy to call the image, Easy to move it and turn it (by the vagueness from Google Earth) and export it to another format.
- Easy vector editing, dynamic line style
- Low memory consumption
🙁
- The interface is a bit bizarre, although after several years it sounds familiar.
- Very difficult to give good print quality in a short time but easy handling of layers,
- Easy to create shapes, although making transparencies is impossible without using materials to the rogue.
- The handling of layouts a nightmare that many of us get used to, would have to search the North cells crying and the UTM grid would only be possible with Geographics.
- With the Google Earth plugin it is possible to open the same Google Earth display but you can not bring it to the map without Use printscreen... at least it supports projection without having to use Geographics.
In conclusion, useful for CAD editing though I would like an XM edition to consume the V8 resource.
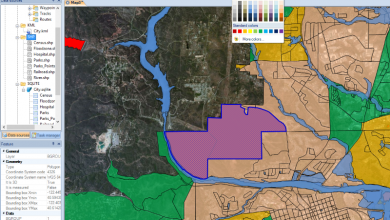
Doing it with Manifold ... almost the same as with ArcView

: )
- In a minute I brought the image directly from Google Earth, easy to export to another format, easy to rectify With respect to the map
- Easy preparation of colorful style for printing, creating shapes as simple Such as ArcView, Although the theming was easier.
- Easy creation of layouts
- Low memory consumption ... with this map
- In short, almost like doing it with ArcView, low cost And with the pride of not having pirated ESRI
- Easy and functional handling of projections, on the fly
🙁
- The somewhat bizarre interface requires some time to get exorcised.
- Not very good quality vector editing, but better than ArcView without extra extensions
- Bizarre 3D handling, although it would have preferred ArcView and some of its extensions
In conclusion, practical for GIS use and to avoid pirating ArcGIS, ArcIMS, ArcSDE, ArcServer, Arc2Eart... although my friends have taken me By gentil.
With Google Earth

: )
- Very good image management, 3D views and the plus of the web geographic base ... fly, navigate, impress.
- Good display of images And data cooked with Manifold even though it goes crazy with stuffed or complex shapes.
🙁
- Just to see, impossible to edit the vector in mass
- Bizarre way to change line style, has no level management, only line fists
- Unable to handle a consistent print
- I could not directly import the dxf
In conclusion, I knew that it is not for GIS / CAD use but practical for bragging,

Then at the meeting the gentlemen were very happy to Painted map and drooling to see him on Google Earth ... his almost null technical knowledge has concluded that we are doing a good job.
Without having to explain the study of values of land, The Building values... much less the precision With a Magellan Mobile Mapper from $ 1,500 and costs end of just $ 6.72 per property ... everything included!
The world is unjust since we are born, to see the resource capacity consumed by the machine (Ram 512) we see that this is the order:
- Firefox (78MB), justifiable because I have the 3.2 beta and that error of consuming memory until the collapse has not changed our Mr. Google
- AutoCAD 2006, (44 MB), before the autosave
- Live Writter (32 MB), the application with which I wrote the post, as always Microsoft optimizing resource
- MSPaint (26MB) ... without words, the most obsolete application since Windows 3.1 consumes that, I have used it to copy the screens
- Microstation V8 (22 MB), the XM version better I did not try, for fear of collapse
- manifold 7 (17 MB)
- Google Earth (12 MB)

- ArcView? ... I collapsed twice, I suppose because of exaggerating the resource and the bad advice of Andr :p
Moral:
Do not ask the elm pears if the person who eats them confuses them with apples ...
Regards, thank you for your patience and we will see each other next year, if in my homeland I can not connect.


Excellent post. Seus texts além de ter um content extremely useful, still funny… hehehe
Good weekend.
Luiz Amadeu Coutinho
Geographer
Online Geoinformation
Thanks Tomas for the clarification, although I understand that that only saves Firefox, which was the one in the foreground, but relatively all the others were in the background so more or less competing in the same conditions ... it is assumed
The comparative memory consumption is not real, since the applications in the background download the memory they are using to visualize the graph, and when you opened the task manager you could only have one application in the foreground, as it is observed In the processor percentage consumption, none was doing any other process.